May 26, 2026
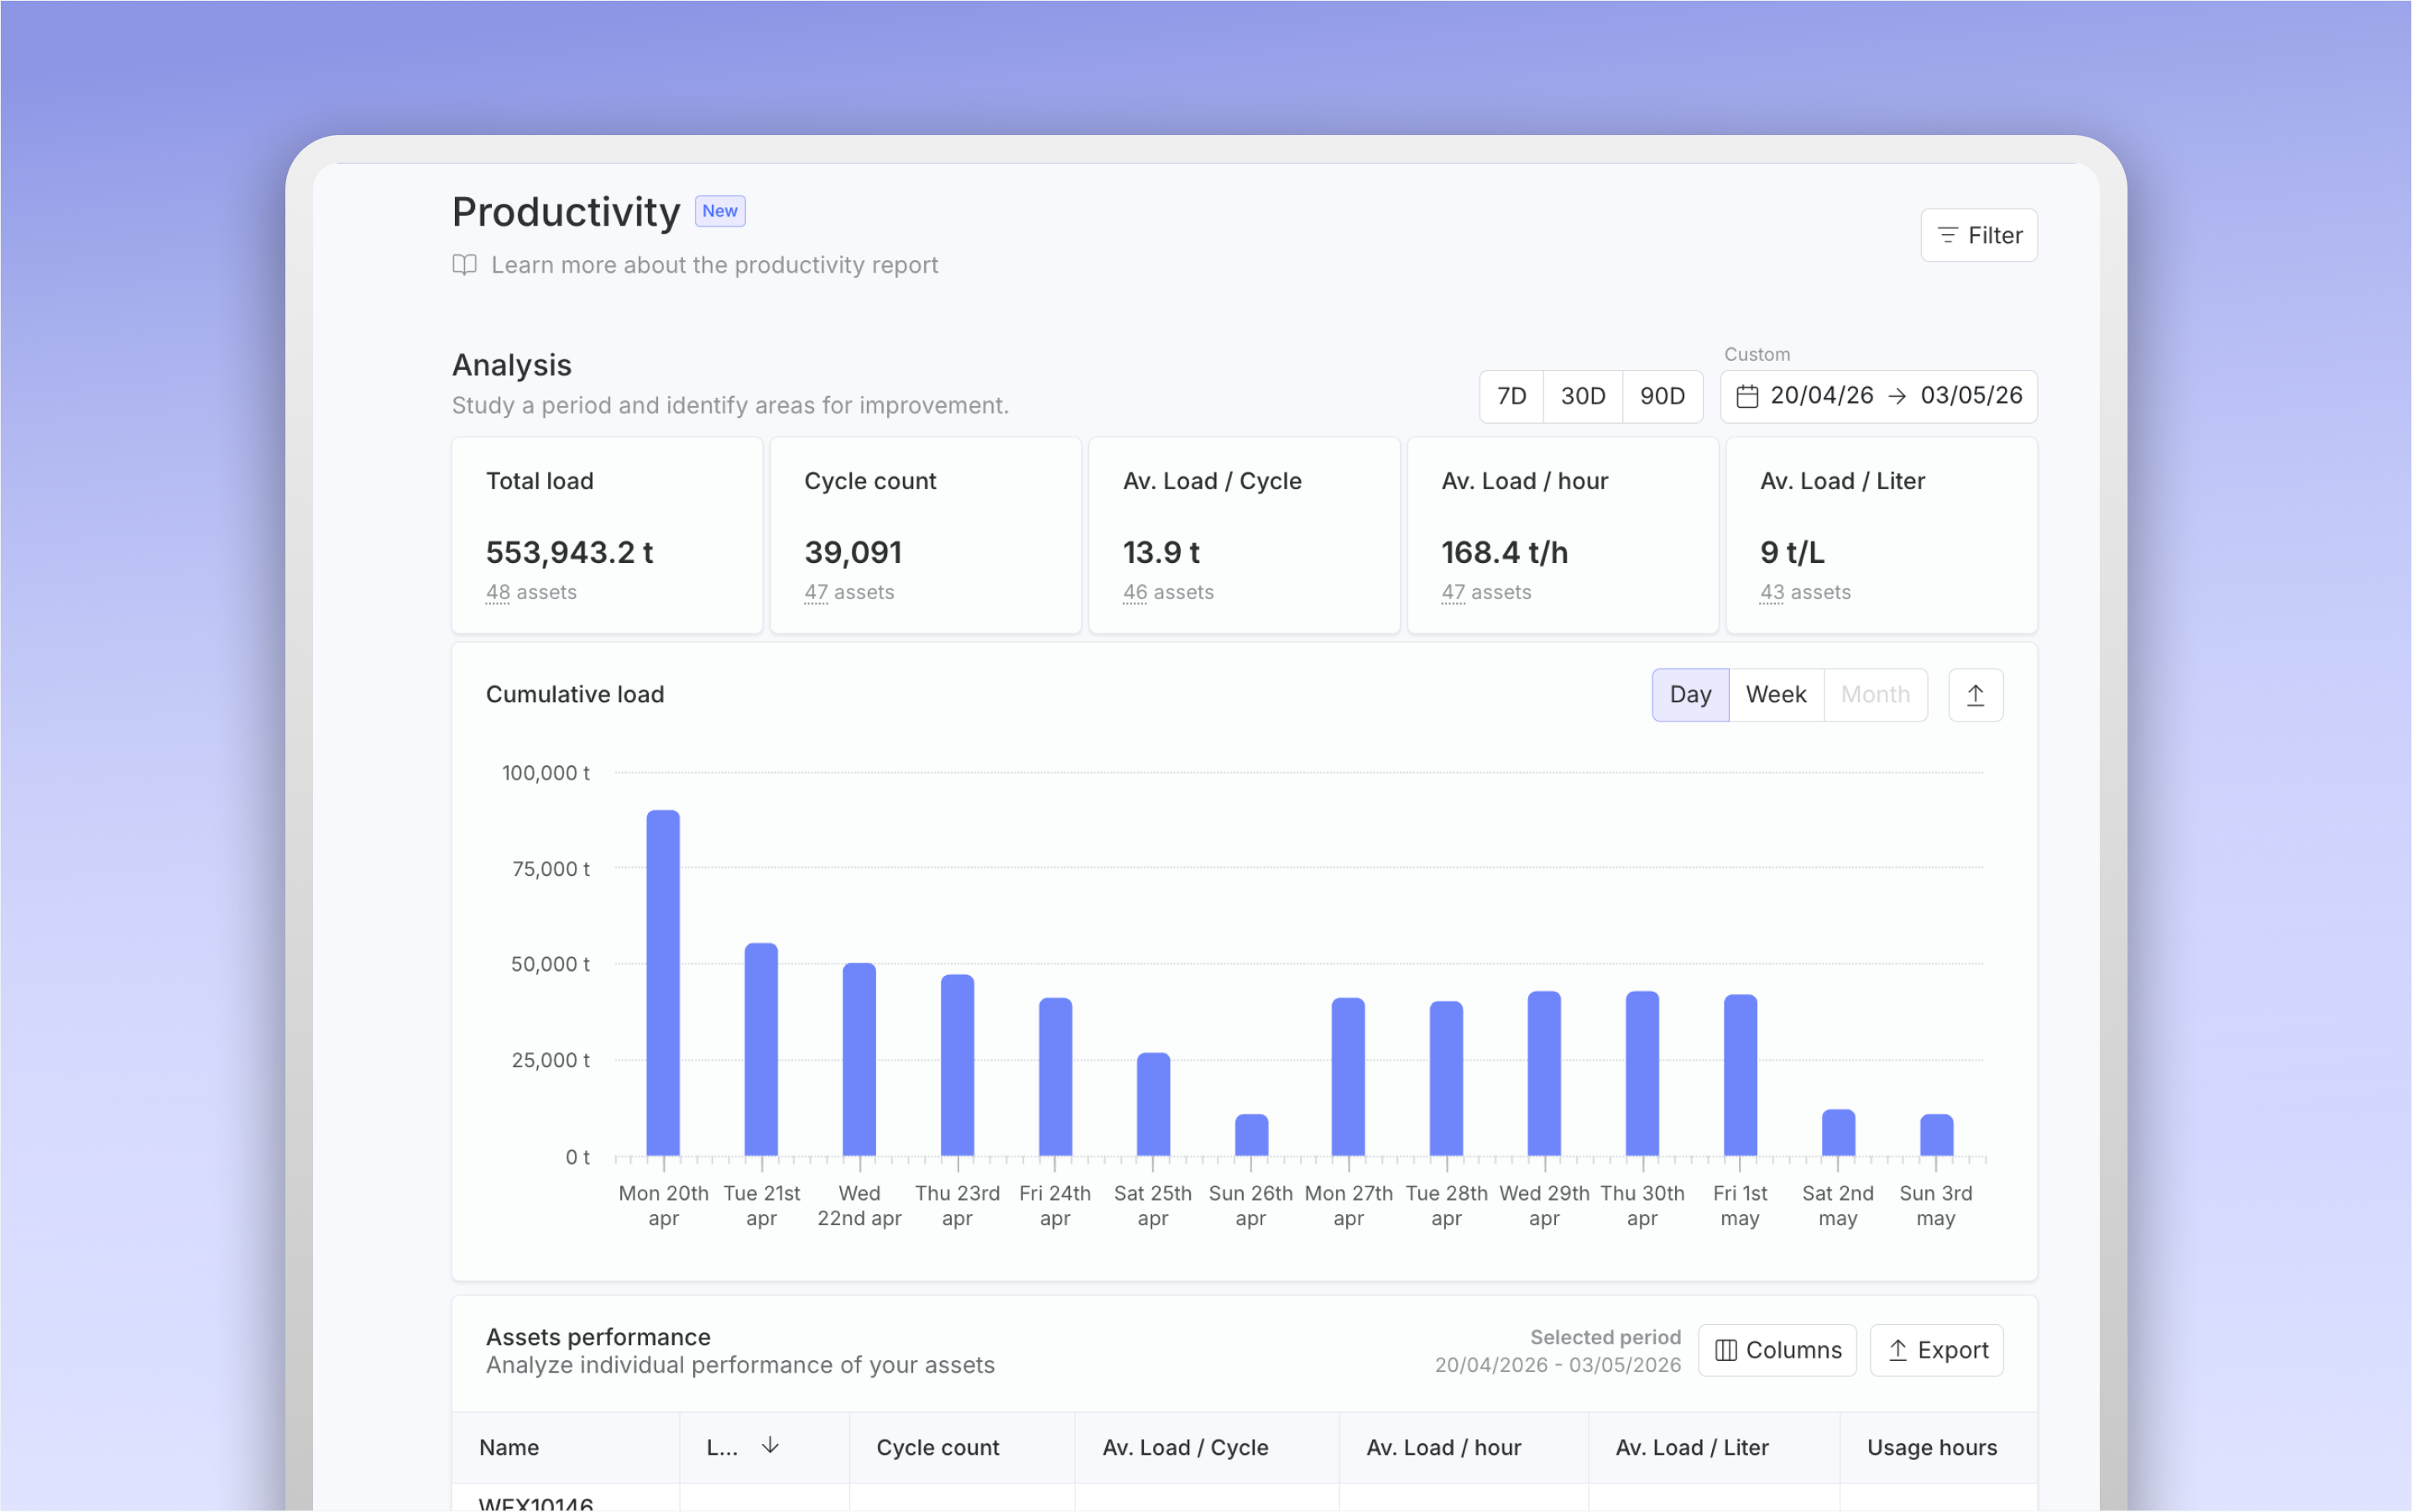
Productivity Report
Knowing whether a machine is running is a start. Knowing what it produces is better.
What's new:
Productivity ratios per machine (Tonnes/h, Load/h, Load/liter…), calculated from weighing systems, operating hours, and fuel consumption.
A performance-driven view: identify underperforming machines on a jobsite in just a few clicks.
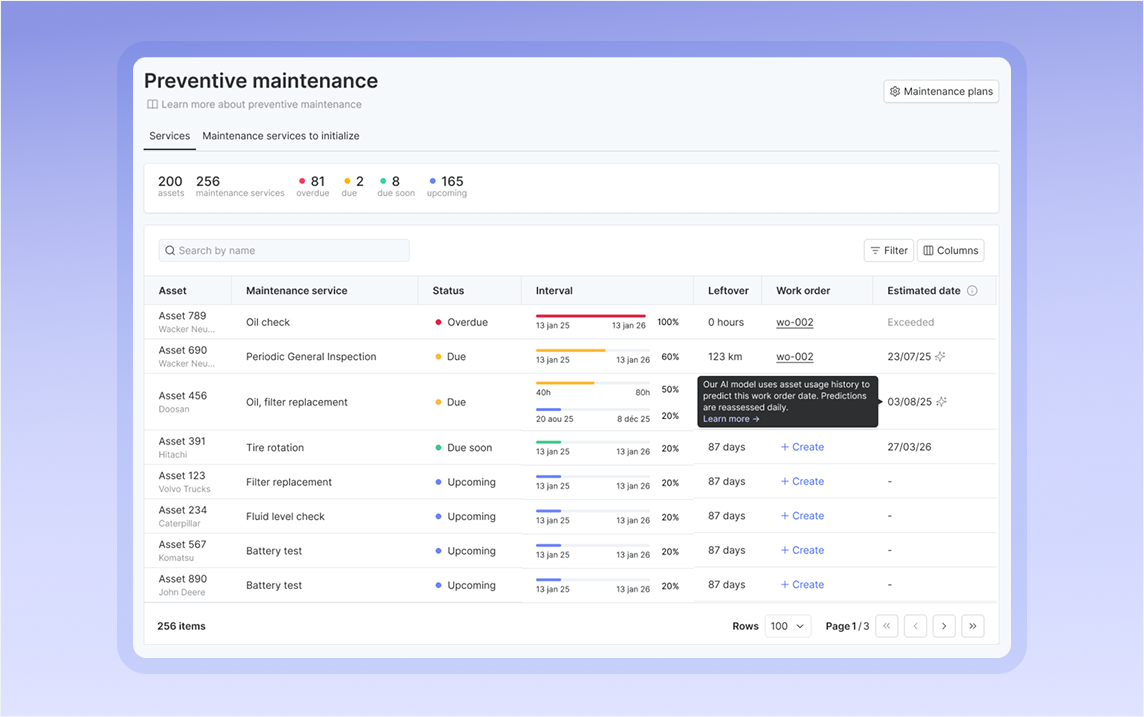
Idle Equipment Tracking
The easiest way to boost your utilisation rate: spot the machines that have stopped running.
What's new:
A new "Idle Equipment" table listing machines inactive since at least two days ago, sortable by how long they've been stopped.
An automatic email alert: set a frequency and an inactivity threshold, and Hiboo sends you the list. You can then archive, redeploy, or resell.